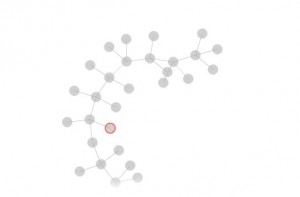
So, we wanted to have some nice visual representations of database schemas and tree structures in a new Flex app of ours. And we didn’t really want to spend a huge amount of time coding up something ourselves.
A little hunt around the web came up with a nice looking Actionscript library called Flare. Looking at the demos on the site it looked like it could do just what we wanted and then some. “Excellent!” I thought (as I am want to be quite excitable in my own head), I’ll get a demo up and running immediately and be able to spec the format of the data we need from the back end. Right, where’s a nice simple example?
Ah hah, they have a tutorial page but, gee, wow, that’s… um, exhaustive, and starting from first principles, and then sort of jumping into the deep end, no middle ground. I can’t find anything in there that states the real data structure expected/needed by the Flare visualisations to work. There’s no basic ‘Quick Start’ guide anywhere.
You can download the full source of the demos, but they too are pretty painful to glean the inner workings of Flare from. And so, here, for my benefit while I work it out, and for your benefit if you are like me and just want a concise description of how this darn API works I give you “A Guide to using Flare”.
Enjoy…
The Basics
Let’s use a simple example to demonstrate things. What I’ll use here is a tree structure showing source systems for a project. You will add Hosts, and then to the Hosts you can add Databases and/or Folders with Files. This should be a simple place to learn the basics of how to show and interact with data in Flare.
It seems the core place to start is a Visualisation (or, being US centric, a visualization).
So, let’s create our class:
import flare.vis.Visualization;
import flare.vis.axis.Axes;
import flare.vis.data.Data;

public class SourceVisualisation extends Visualization
{
	public function SourceVisualisation(data:Data=null, axes:Axes=null)
	{
		super(data, axes);
	}
}
So, currently doing nothing extra over the base Flare ‘Visualization’… for now!
Now to use this we need to feed it some data. Data is another Flare class, and at this point let’s just consider it a collection of nodes (the circles in the picture up there), and edges (the lines).
Let’s define a few things:
public var sourceTree:SourceVisualisation;
public var dataArray:Array = [
  {type:'host',id:'1',name:'Server 1'},
  {type:'db',id:'2',name:'Database 1',host:'1'},
  {type:'dir',id:'3',name:'Folder 1',host:'1'},
  {type:'file',id:'4',name:'Data File 1',dir:'3'},
  {type:'file',id:'4',name:'Data File 2',dir:'3'}
];
public var data:Data;
Now, the dataArray there is the data we want to display as a tree. The basic idea is that it has a ‘type’, being a ‘host’, ‘db’, ‘dir’ or ‘file’ (Host, Database, Directory or File), a name, and id, and if it’s of type ‘dir’ it’ll have a host id, and if it’s of type file it’ll have a directory id. (If your data was more general you’d just have a common field called ‘parent’ with an id in it and be done with it, but this is matching an expected data input).
From what I can gather there are some import features included with Flare for pulling in JSON or some XML formatted data, but I couldn’t quite work out how they could work out the relationships between your nodes.
So, we’ll do it ourselves:
public function buildTree(arr:Array):Data{
	var d:Data = new Data(true);
	//Keyed lookup for easy edge addition in step 2
	var nodeLookup:Object = {};
	var row:Object;
	var ns:NodeSprite;

	//Step 1: Add all rows of data;
	for each(row in arr){
		ns = d.addNode(row);
		nodeLookup[row.id] = ns;
	}

	//Step 2: Add edges
	for each(ns in d.nodes){
		if(ns.data.hasOwnProperty('host')){
			d.addEdgeFor(nodeLookup[ns.data.host],ns);
		}
		else if(ns.data.hasOwnProperty('dir')){
			d.addEdgeFor(nodeLookup[ns.data.dir],ns);
		}
	}

	return d;
}
All this function does is takes in our array, makes a Node for every entry in it, and adds it to the Data object. Then it goes back through and creates an edge for each case of a parent/child relationship.
And to use this in a visualization is pretty easy:
data = buildTree(dataArray);
sourceTree = new SourceVisualisation(data);
Now, let’s just add this to the stage (I’m running this in a function that is called on creationComplete within a Flex App):
sourceTree = new SourceVisualisation(data);
sourceTree.x = 100;
sourceTree.y = 50;

//This is purely to get around Spark's dislike of addChild
var s:SpriteVisualElement = new SpriteVisualElement();
s.addChild(sourceTree);
addElement(s);
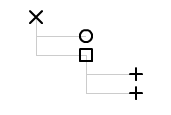
So, this now has the visualisation on the stage, but we haven’t told it what to look like.
sourceTree.operators.add(new IndentedTreeLayout());
sourceTree.operators.add(new ShapeEncoder("data.type"));
sourceTree.data.nodes.setProperties({fillColor:0, lineWidth:2});
sourceTree.update();
Which says to:
- Lay it out in the pre-defined Tree layout
- Set the shape of the nodes based on the ‘type’ attribute within the data of each node (the nodes get the data from your dataset placed in an object called data)
- Set the nodes to have no fill and a line width of 2
And that’s it for a basic tree of data… it gives us:

Which is good for a small amount of code, not very colourful though. But if you add
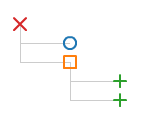
sourceTree.operators.add(new ColorEncoder("data.type", Data.NODES, "lineColor", ScaleType.CATEGORIES));
then your tree will look like:

Which is a bit prettier. However those shapes aren’t particularly indicative of the objects they represent, at least I don’t tend to think of a host as a cross and a database as a circle. So we want to replace these shapes with icons. Now, the way they seem to think this is done is via a 3 tier process of a ShapeEncoder, which looks at the data within a node and then creates a new attribute which identifies what sort of shape it will be (so shape=’square’). Then there is a ShapeRenderer which uses this to actually render the shape, but it doesn’t know how to actually draw the shape, instead it uses a ShapePalette to pick from.
It’s all needlessly complicated and abstract, and as you dig through things, the abstraction hasn’t really worked as NodeSprites are created by the Data object (which surely should not know anything about the visual objects that make up its respresentation) for each node. These have a ShapeRenderer already coded into them, which is another level of knowledge… it’s all a bit too incestuous.
And so I’ve been pulling it apart a bit and trying to make it more friendly to use on a day to day basis in Flex, and bring it up to date to Flex 4.6, as this is all coded with an MX rather than Spark mentality.
So we’ll be trying to make the Nodes be as agnostic as possible, and rather than needing a render process be a skinable component instead.
This I have not actually written as yet, so my next post may refute this plan entirely! But stay tuned, as we’ll make Flare more easy to use at the very least!
